
7 Ways Smart Dashboards are Replacing Manual Reporting in 2025
Key takeaways
-
Smart dashboards allow you to view all your performance data in one place, giving you a clear understanding of what efforts are working best without the manual leg work.
-
Businesses are switching from manual reporting to smart dashboards for the AI features that can flag and predict issues, gaining far superior decision-making abilities.
-
Smart dashboards can provide in-depth and real-time insights into the customer experience and how they move through your sales funnel, enabling you to respond to issues quickly and precisely.
A Blackline report found almost 70% of businesses have made significant decisions based on outdated or incorrect data. In fast-moving industries, those kinds of blind spots can cost businesses revenue, reputation, and opportunities.
For years, businesses have relied on manual reporting: downloading spreadsheets, cross-checking numbers across platforms, formatting charts, and building slide decks by hand. It’s time-consuming and error-prone, and by the time a report is ready, the data is often already outdated.
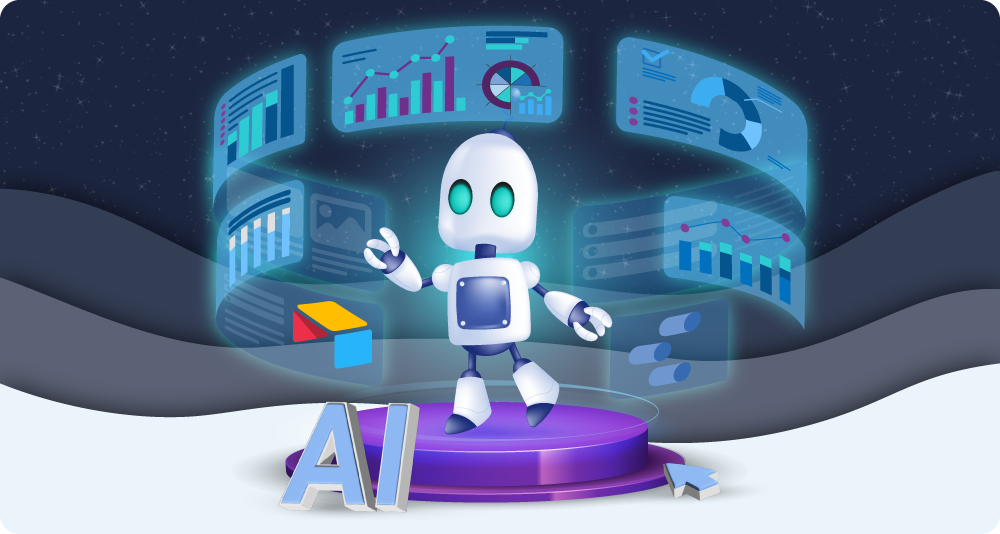
Enter, smart dashboards! Smart dashboards are automated, interactive reporting tools that pull real-time data directly from your business systems (e.g., Shopify, Stripe, Google Analytics, CRM platforms, or accounting tools) and turn it into clear visuals, key performance indicators (KPIs), and insights. Instead of static files that take ages to be updated, you get a live window into how your business is performing.
There are different types of smart dashboards, depending on what you need to track. For example:
- Executive dashboardsgive a high-level overview of key business metrics like revenue, profit margins, and customer growth.
- Marketing dashboardstrack campaign performance, ROI, traffic sources, and conversion funnels.
- Sales dashboardsshow pipeline activity, win rates, and sales rep performance.
- Operational dashboardsmonitor inventory, order fulfilment, team capacity, and service levels.
- Customer support dashboardssurface ticket volumes, response times, and satisfaction scores.
- Finance dashboardsautomate budget vs actual comparisons, runway projections, and cash flow trends.
These types of dashboards are just the start; there are countless uses for making your operations smarter. This article will explore 7 practical ways smart dashboards are replacing manual reporting across different kinds of businesses, providing highly useful applications and compelling arguments for making the switch.
Let’s dive in:
Why smart dashboards are replacing manual reporting
Smart dashboards provide improved efficiency in several areas. They save time, reduce errors, and give greater insight into business performance.
Some teams spend more than 25% of their time at work on manual tasks. Automating reporting frees up staff to do other things, with automations saving up to 30% of time and costs. Not only can manual reporting be exceptionally dull work, but it can also drain staff of the desire to complete more exciting tasks.
Since smart dashboards pull from multiple sources, they provide a greater insight into your business’s performance. They provide what is called a single source of truth (SSOT), which is when data from numerous sources is aggregated into one location.
To make the right decisions, business owners need holistic insights from every part of their business (e.g., customer and service data, marketing and sales conversion rates, website performance data etc.) and SSOTs provide this.
Smart dashboards can also be considered a self-service analytics tool. This is when non-technical users (e.g., marketing executives) can interact with dashboards, create customised reports, perform complex data queries, and generate useful insights by themselves. This frees up your IT department or specialised data team and can be achieved with minimal knowledge of data principles.
Furthermore, smart dashboards allow business owners to view performance data on the fly. The amount of data aggregated by smart dashboards can also be vast, putting them miles ahead of what you could understand from a glance at a spreadsheet.
Finally, smart dashboards often have AI features, which come with numerous creative applications. AI can spot things that might be too subtle for human users. For example, they can notice and flag anomalies before they grow into something concerning. Plus, predictive analytics can forecast what might occur and suggest what actions to take to set your performance on the right course.
We’ll now explore how you can exploit these benefits in real ways:
7 ways smart dashboards are replacing manual reporting in 2025
Earlier, we mentioned the different types of dashboards – executive, marketing, sales, operational, customer support, and finance. Let’s take this to the next level and explore the practical applications of smart dashboards. We’ll be using digital service providers, and e-commerce and SaaS businesses in our examples:
1. Real-time insight into revenue and other metrics
One of the most common and valuable uses of smart dashboards is gaining live visibility into key revenue metrics. E.g., total sales, refunds, average order value, and net profit.
In a manual setup, teams often export reports from Shopify, Stripe, or accounting software into spreadsheets, where they spend hours settling figures and arranging their data. By the time the numbers are shared, they’re already outdated.
Smart dashboards automate this entire process, connecting directly to your e-commerce platform, POS system, or subscription billing tools and updating in real time. This means business owners and decision-makers can track performance as it happens; you won’t have to wait for the end-of-week reports or monthly roundups.
For e-commerce businesses, this might include live views of today’s sales, top-selling products, and refund spikes. For SaaS companies, it’s about monitoring MRR, ARR, churn, and expansion revenue as new subscriptions come in or drop off. And for digital service providers, dashboards can track project income, billable hours, or client-specific revenue streams.
These real-time insights make it easier to respond quickly to things like launching a flash sale, adjusting your ad spend, or reaching out to a customer at risk of churning.
2. Attributing results and comparing your efforts
Marketing teams often struggle to know which channels are driving the best results. When they manually pull performance data from platforms like Google Ads, Facebook, Instagram, and email analysis tools, it makes the process of comparing really complicated.
Smart dashboards solve this by consolidating all your marketing data in one place. They automatically pull in whatever metrics you want (like impressions, clicks, conversions, cost-per-acquisition (CPA), and return on ad spend (ROAS)) from each channel.
For e-commerce businesses, this helps you see whether Google Shopping or Instagram Stories is bringing in more revenue per pound spent, allowing you to optimise your budget quickly.
For SaaS companies, dashboards can show lead quality by channel, helping you prioritise the ones that drive users who actually convert and stay. And for digital service providers, multi-channel dashboards make it easy to report on client campaigns and compare performance without jumping between tabs.
3. Monitoring your inventory and capacity
Another great application of smart dashboards makes use of them giving businesses a real-time view of their inventories and capacity for projects. By pulling data from systems like your warehouse management software, supplier feeds, project tools, or scheduling apps, you can see what’s running low, what’s overstocked, and what’s holding up workflow without digging through multiple reports.
For e-commerce businesses, this might mean tracking inventory turnover, alerting you when popular SKUs are close to selling out, or when seasonal products are sitting too long. And for digital service providers, it helps you monitor team capacity, project hours, and resource allocation across clients. For easy viewing, you could display this data as a heat map.
4. Tracking the customer journey funnel
Understanding how potential customers move through your sales funnel is essential for improving conversions but mapping that journey manually can be messy.
Teams often have to combine data from Google Analytics, email tools, CRMs, checkout platforms, and support logs to understand where people are dropping off. Smart dashboards simplify this by pulling funnel data and visualising it into a single flow.
You can see how many people visit your site, how many add to their cart or start a trial with you, and where they lose interest. For e-commerce businesses, a funnel dashboard might show a drop-off between product views, cart additions, and completed purchases, highlighting issues with UX or pricing.
For SaaS companies, dashboards can track user signups, onboarding steps, and trial-to-paid conversions, helping you pinpoint where people are stalling.
5. Understanding customer experiences
Beyond their journey through your funnel, you can also use a smart dashboard to examine customer experiences.
Shaped by every interaction with your business, customer experience is vital to your success. If a customer has to wait three days for a support reply or leaves a negative review that no one responds to, it can quietly damage your brand and increase churn.
Unfortunately, manually monitoring customer support logs, reviews, and satisfaction surveys is time-consuming. Smart dashboards can make this a lot easier by displaying customer experience data visibly and in real time. By pulling in support tickets, live chat volumes, CSAT and NPS scores, review ratings, and even open-ended feedback, you get a clear view of how customers feel and where issues arise.
For e-commerce businesses, dashboards can flag spikes in refund-related queries or delays in shipping complaints. For SaaS companies, they can track support backlog, sentiment trends, and customer health scores to catch at-risk accounts. For digital service providers, dashboards could be used to monitor client feedback forms and project sentiment across accounts.
6. A command centre for your whole operation
There are always numerous moving parts to a business’s operation. With a manual setup, teams often work in silos, sending updates over email or Slack and relying on weekly check-ins.
Smart dashboards act as a central command centre that gives you a real-time pulse on your entire operation. They bring together metrics from multiple departments into one clear view.
For e-commerce businesses, this might mean tracking fulfilment SLAs, returns processing, low-stock alerts, and courier delays. For SaaS companies, it could include system uptime, active users, ticket backlogs, and DevOps status. For digital service providers, the focus might be on project timelines, team utilisation, client communication, and overdue invoices.
7. AI-supported decision making
With constant developments in AI, smart dashboards are increasingly able to help with your decision-making. Smart dashboards with built-in AI features can analyse patterns, flag anomalies, and even recommend actions based on your data.
Instead of spending hours digging through reports, teams get intelligent suggestions and alerts: a spike in abandoned carts, a sudden change in customer sentiment, or a product with growing refund requests. These alerts and AI summaries don’t just indicate when there’s an issue, they can often suggest causes and ways to resolve them.
For e-commerce businesses, AI might recommend adjusting pricing on slow-moving items, flag a surge in negative reviews, or suggest reordering a trending SKU earlier than expected. For SaaS companies, it can highlight churn-risk customers based on usage patterns or forecast MRR under different growth scenarios.
Now that you know just a few of the amazing things you can do with smart dashboards, it’s time to think about making the switch:
Tools for switching to smart dashboards
First thing’s first: setting up a smart dashboard doesn’t have to be a complex operation involving a team of data scientists. There are several user-friendly tools you can use:
Airtable
Airtable’s interface allows you to build custom dashboards. It’s especially useful for teams managing projects, content calendars, or customer pipelines who want a more dynamic view of their workflows.
Looker Studio (previously Google Data Studio)
Looker Studio is a free and flexible tool from Google that lets you build interactive dashboards by connecting to data sources like Google Analytics, Google Ads, and more. It’s ideal for marketing and website performance tracking, and it’s beginner-friendly if you’re already using other Google tools.
Other smart dashboard tools to consider
Databox: Designed for quick and easy dashboard creation with pre-built templates for sales, marketing, and customer support. Great for small businesses and agencies.
Klipfolio: A lightweight but powerful tool for building real-time dashboards from dozens of data sources.
Microsoft Power BI: Great for businesses already using Microsoft 365. Offers advanced analytics and integrates well with Excel, SharePoint, and Dynamics.
Tableau: Powerful visualisation platform used by many large companies. It’s excellent for data exploration and storytelling, though it can have a steeper learning curve.
Each of these tools allows you to connect directly to your business data, update reports automatically, and create visual dashboards that can be shared with your team or clients. The right choice depends on what data you need to track, your budget, and how hands-on you want to be with setting things up.
Final thoughts
Now that you’re a fully-fledged expert in smart dashboards, you’re probably ready to get started right away. But, if you want a little more help setting up, reach out to us here at purpleplanet. We provide a range of services including the creation of automations.

