
How To Diagnose A Slow WordPress Website
Nobody likes a slow website.
New research by Google has found that 53% of website visitors will leave a mobile site if it takes longer than 3 seconds to load.
To put that into a perspective, if your website is slow you might be losing more than half of your potential customers.
Fixing page speed issues on your website might have a positive impact and increase your sales and revenue.
Let’s put that money in your pockets.
Are you ready to get started?
Website speed can be affected by various factors.
The first step to solving any problem is realizing what is causing it.
How To Diagnose A Slow WordPress Website
Trying to identify the problem without knowing where to look is like looking for a needle in a haystack.
The good news is that there are simple and quick methods that can help you identify how fast your website is and what is slowing it down.
To get a better perspective on your website performance we recommend you use different tools and test it from multiple locations around the world. Do not rely on a single tool or software to get your results, as they all have their own database and their own way of working.
Always check your mobile performance.
Most users use a 4G or 3G connection, which can be significantly slower than the wireless Internet in your home. That’s why it’s important to make sure your site performs well on mobile.
Page speed on mobile is a landing page factor for Google Search and Ads. Мore reasons to work on improving it.
Here are some methods and tools we found helpful during our years of experience.
Method 1: Using Think With Google Performance Tool
Think With Google is a newly-developed tool by Google that can help you evaluate your website speed performance.
The report-based tool is full of data, statistics, and trend reports coming from insiders with access to Google’s huge database of analytics.
You can see how fast your website is on a 4G connection, see what you can do to improve it, and check how your mobile site speed ranks compared to your competitors.
The ‘Think with Google’ tool is pretty easy to use.
First, you need to enter your domain name and click Enter.
Wait for the report to generate and this is what you’ll see.
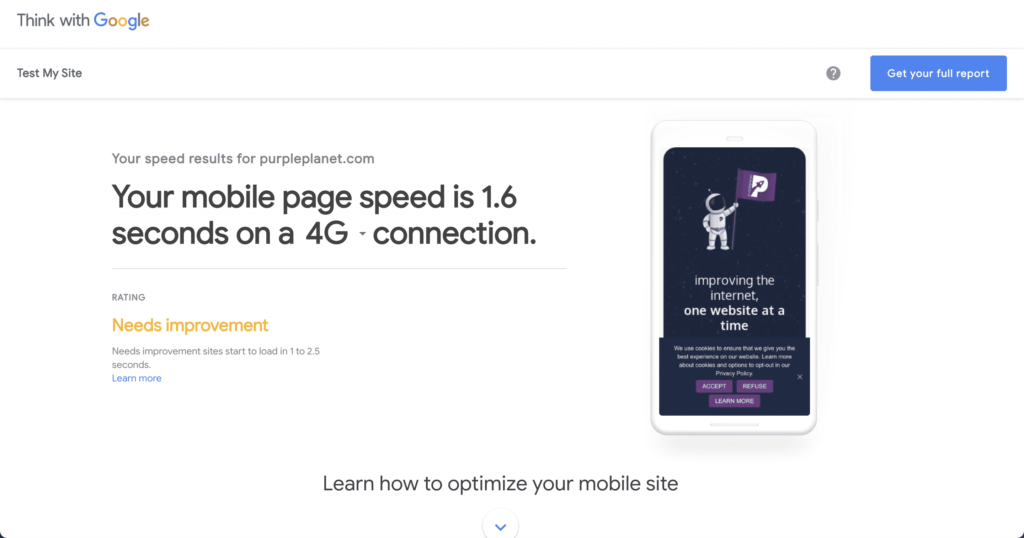
We ran the report for our own website and we see that our mobile page speed is 1.6 seconds on a 4G connection. Not a bad result, but it can definitely be improved.
Once you scroll, you’ll see a list of recommendations you can implement to improve your website speed.
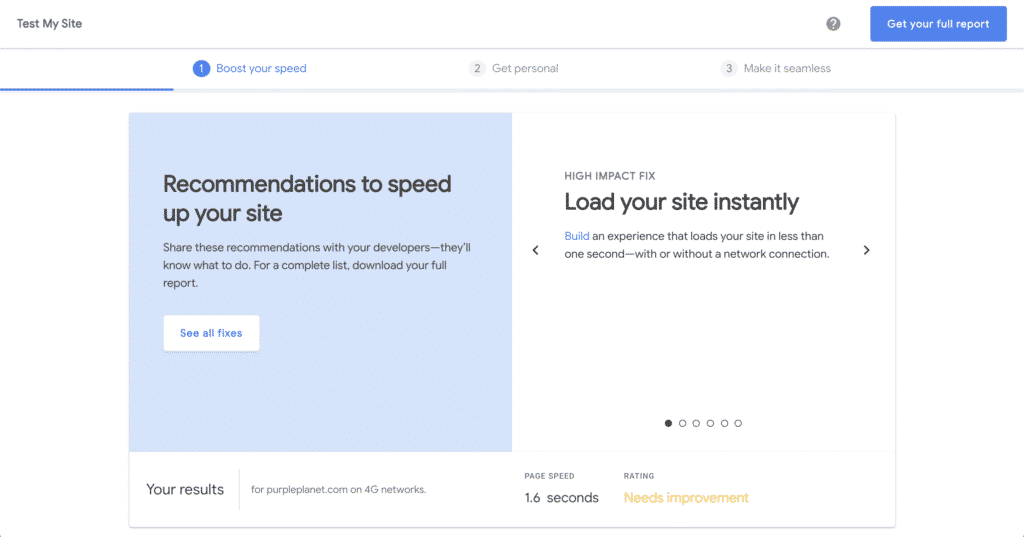
These recommendations are more generic, but you can also download a full report from various calls to action across the page.
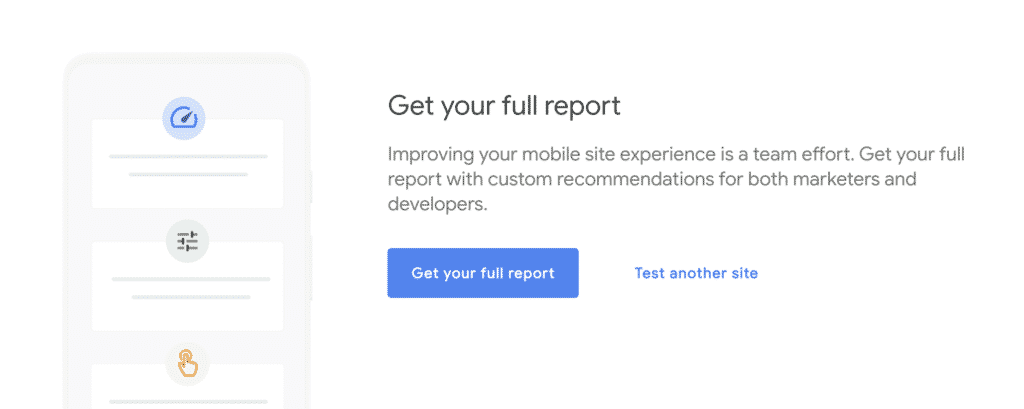
Let’s do that.
Shortly after you enter your email address, you’ll receive an email with a PDF document of your performance report.
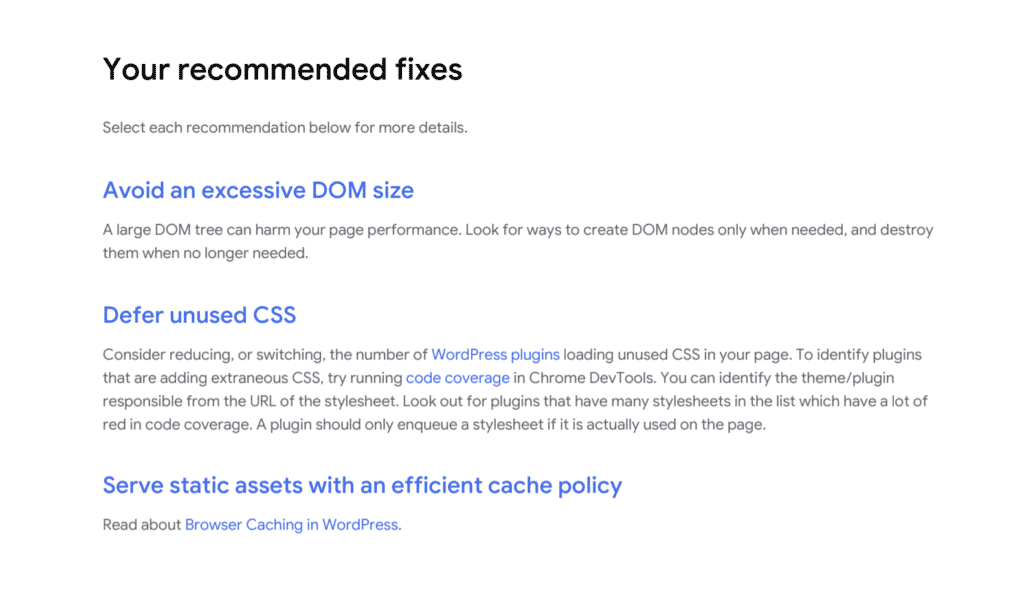
There are a couple of pages with general information about page speed, why it is important, etc. The most important part of the report is the developer checklist. Make sure to screenshot or to write the custom recommendations down.
‘Think with Google’ is using data from Lighthouse.
Lighthouse is another tool created by Google. It’s an open-source, automated tool that you can use on any web page you open in a Google Chrome browser.
It has audits for performance, accessibility, progressive web apps, SEO, and more.
You can run Lighthouse from the Command Line in Google Chrome Dev Tools or as a Chrome extension.
If you wish to generate a full report just using the Lighthouse tool, open your webpage in Google Chrome.
Press F12 or right-click somewhere on the screen and click “Inspect” to open the page inspector.
Then click on the “Lighthouse” tab.
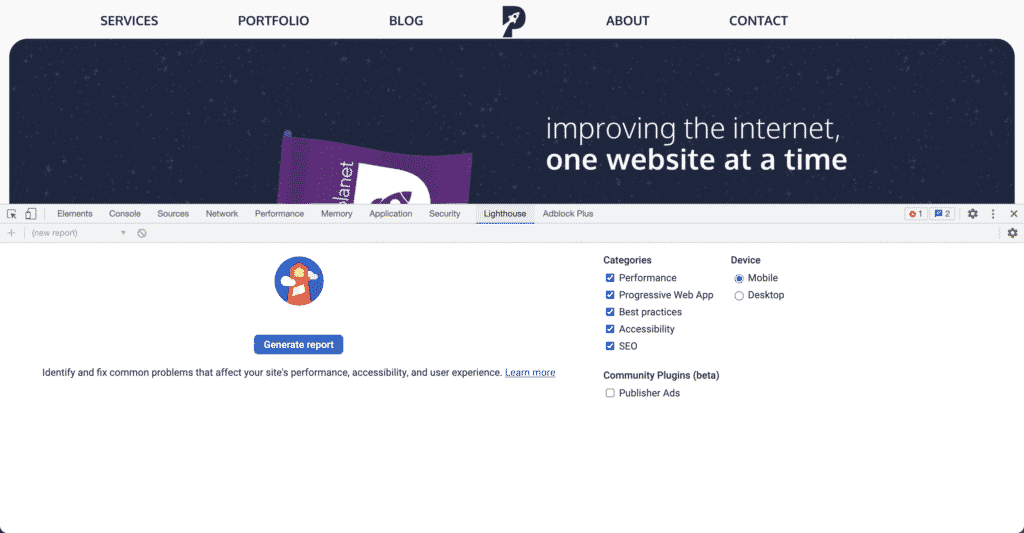
Click the “Generate report” button and it’ll start to run a series of audits. You can use the filters on the right to include or exclude different aspects from the audits. You can test your website on mobile and desktop.
Once the audits are done, the tool will generate a report on how well the page performed.
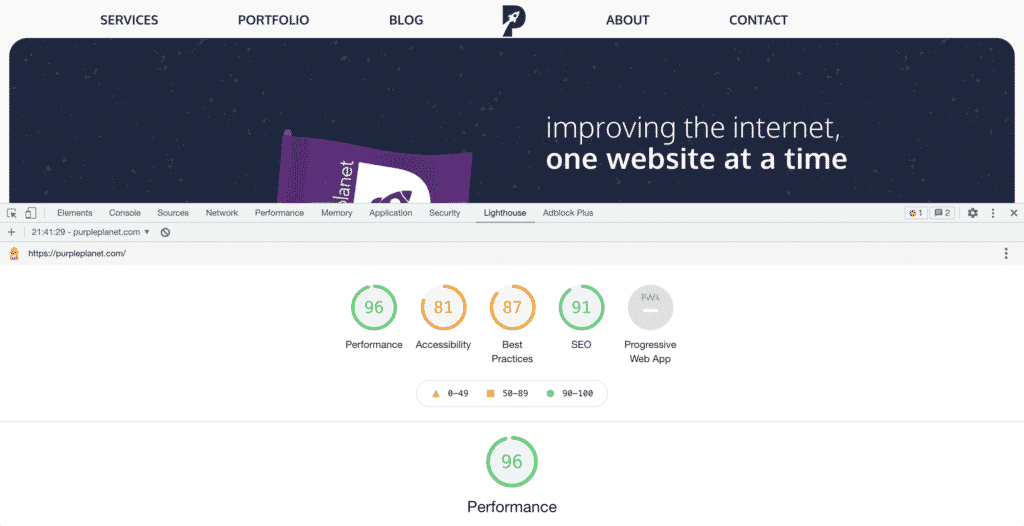
The Lighthouse tool will grade your website on different aspects – performance, accessibility, usage of best practices, and SEO.
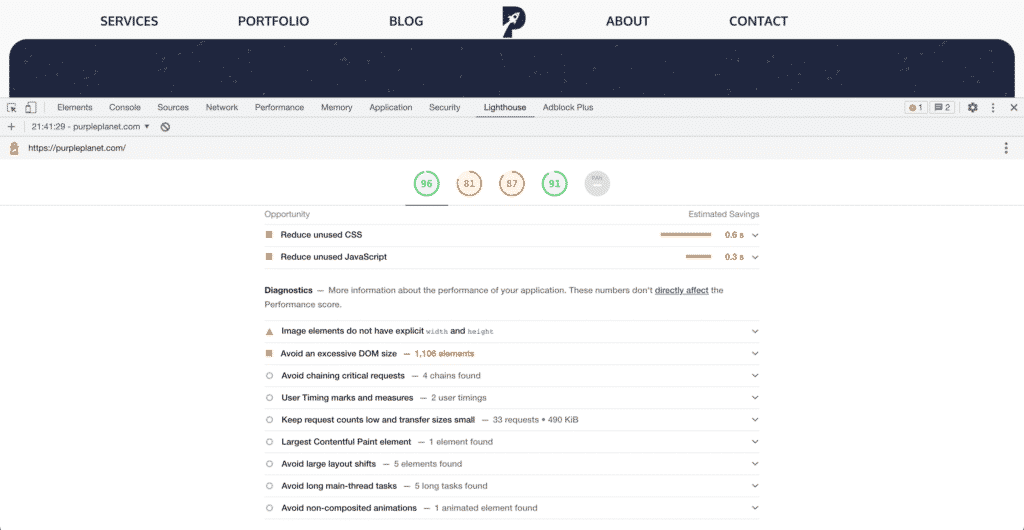
Scroll a bit more and you’ll see diagnostics – things you can do to affect the website’s overall performance.
Method 2: Using Google Chrome’s Performance Tool
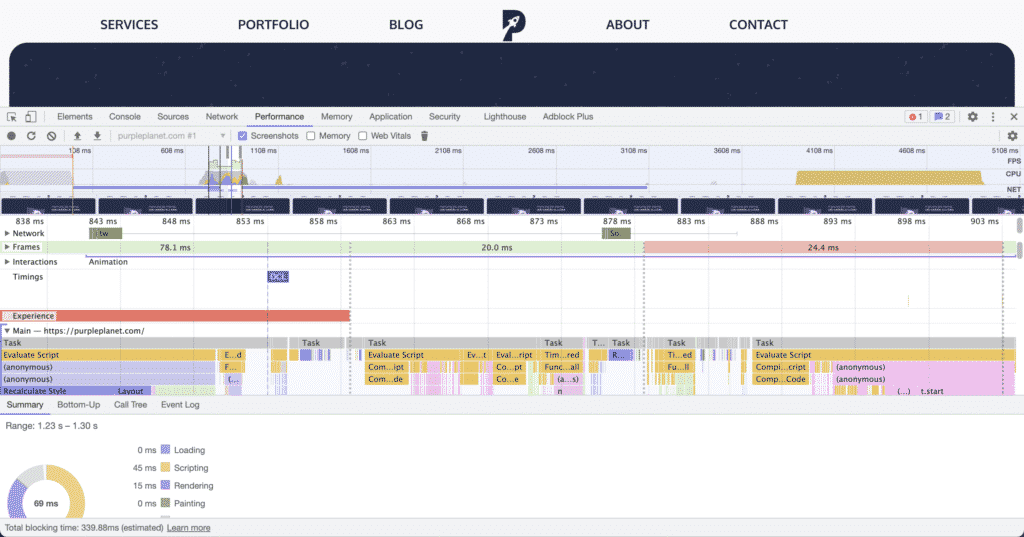
The Google Chrome performance tool gives a more technical analysis of your website speed. The tool provides a visual representation of the loading of files and images on a certain webpage.
You can see which resources are loading first, how long it takes for the different types of files to load and how many seconds are needed for a particular web page to fully load.
To access the tool, open the webpage you want to test in the Google Chrome browser. Press F12 or right-click somewhere on the screen and click “Inspect” to open the page inspector.
Click on the “Performance” tab.
Click the record button so the browser will start recording. The button should turn red once it’s enabled.
Refresh the website page and wait for the website to fully load. When that’s done, click the red record button to stop recording. This is the screen you’re going to see.
Expand the tab to see the order in which the different files and elements are loading, their size, and the loading duration of each of the assets on your website. The Waterfall tab is a timeline that shows when and how long the different files take to load. The wider the waterfall block is, the longer it took to load.
All that can help you determine what’s holding up your website from loading fast.
Remember that the tool does not test the website as a whole. Different pages might have different issues, so make sure to test all of the important pages of your website.
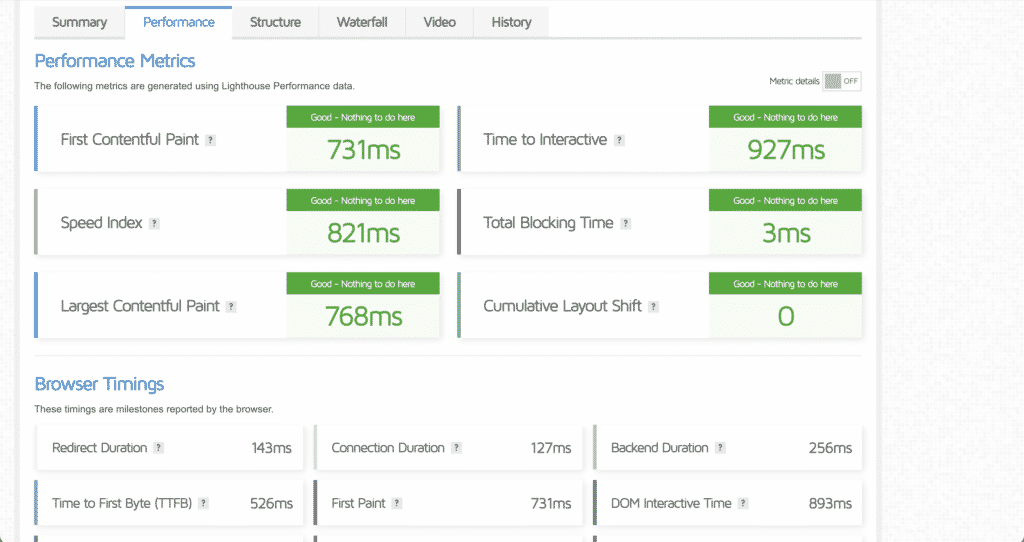
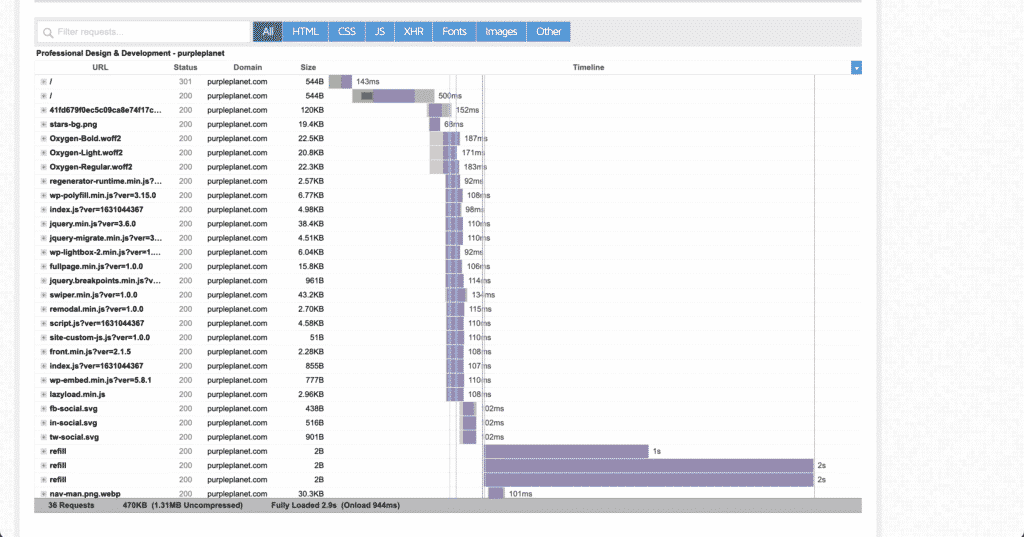
Method 3: Using the GTmetrix online tool
GTmetrix is an easy-to-use performance testing tool that generates detailed reports for your website. Once you get your results, you’ll also see custom recommendations you can implement to improve your overall score.
GTmetrix analyses your page using Google Lighthouse audits and gives you actionable insights for performance optimisations. You can test your website from different locations across the continents. You can also change browsers, connection speeds, and much more.
You can even compare your website’s performance to your competitors’ and see what their score is, and what they are doing differently when it comes to page speed optimisation.
To be able to access all of these features you need to create a free account.
Once you’ve created your account, enter your website URL and click “Test your site” to generate the report.
Here’s what the report looks like.
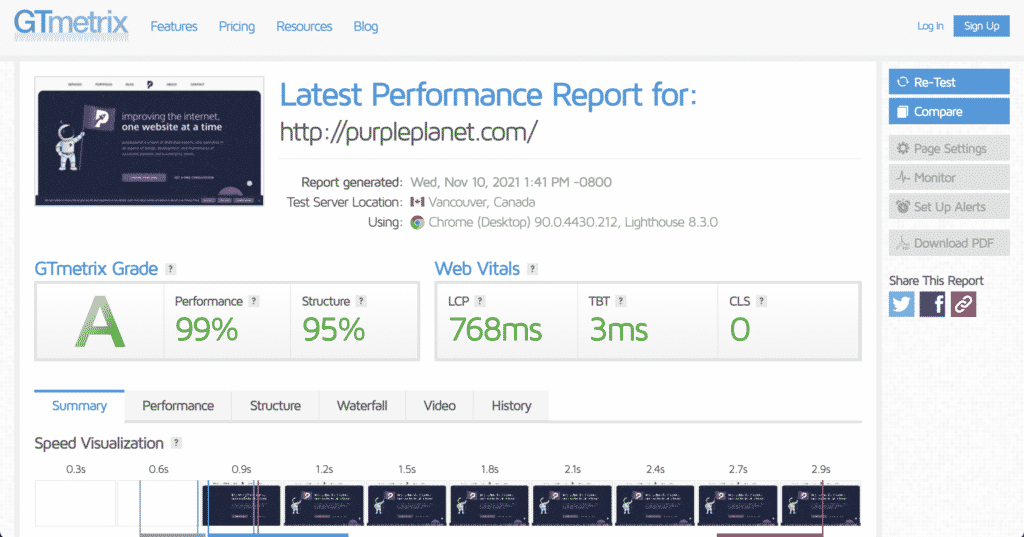
We’ve tested how the website performs from Canada on a Desktop device that uses Google Chrome as an internet browser.
The report generates information on overall performance, what the top issues on your web page are, what you can do to improve the results, what the website structure is, and more.
One of the best features is the waterfall visualisation, i.e. which elements load first and which load last on your webpage.
Method 4: Using the Pingdom online tool
Pingdom is an easy-to-use online testing tool, which comes with free and premium plans.
You simply need to enter your web page’s URL, select a testing region and click “Start test”. With Pingdom, you can monitor your website’s uptime, performance, and interactions for a better end-user experience.
The free version does not provide a lot of information, but if you also use it to compare the results from different tools it’s more than enough. Their plans are really affordable so you can consider upgrading.
The free version grades your score, gives you a list of recommendations to improve your current grade, different content sizes by content type, file requests, and webpage response codes.
When you use Pingdom, we recommend you test your website from different locations that are relevant to your target audience, to understand how slow your website actually is for your customers.
Let’s see the results for purpleplanet.
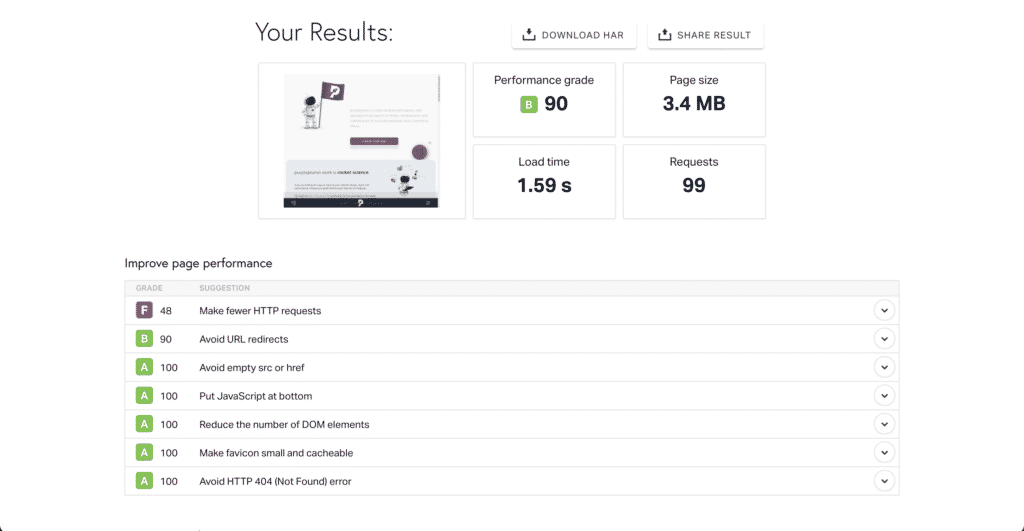
You can see performance grade, load time, and the page size in MB. You’ll also receive a list of recommendations on what you can do to improve your score.
Method 5: Using the WebPage Test online tool
WebPage Test was originally developed by Patrick Meenan for internal use and was open-sourced in 2008. The tool is completely free to use.
WebPage Test is another great online tool that allows you to test how your website performs from different locations around the globe and in different browsers.
Not only that – click on the advanced settings button and you’ll be able to test different types of connections – cable, 3G, 4G and all on different desktop resolutions.
Let’s insert the purpleplanet URL and test it out.
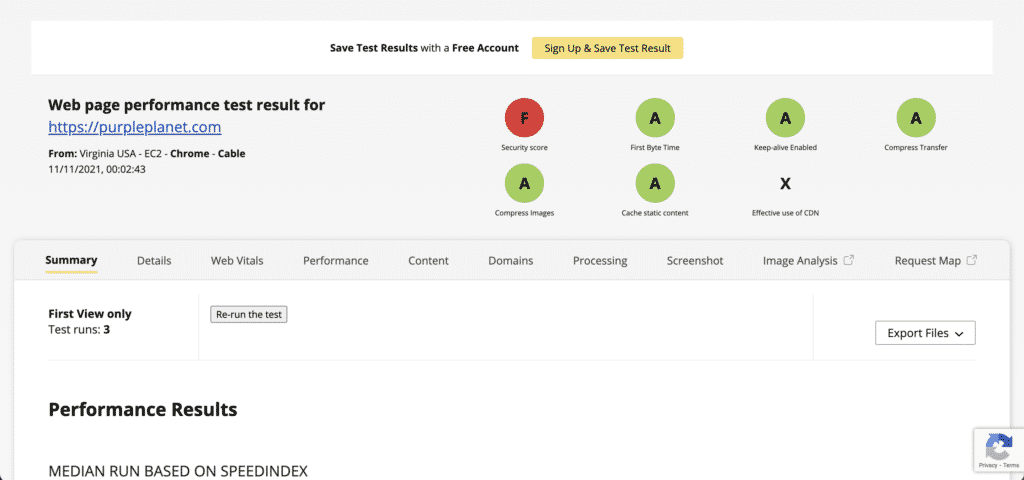
The tool provides you with overview grades of different aspects such as security, transfer compression, static content cache, image compression, and more.
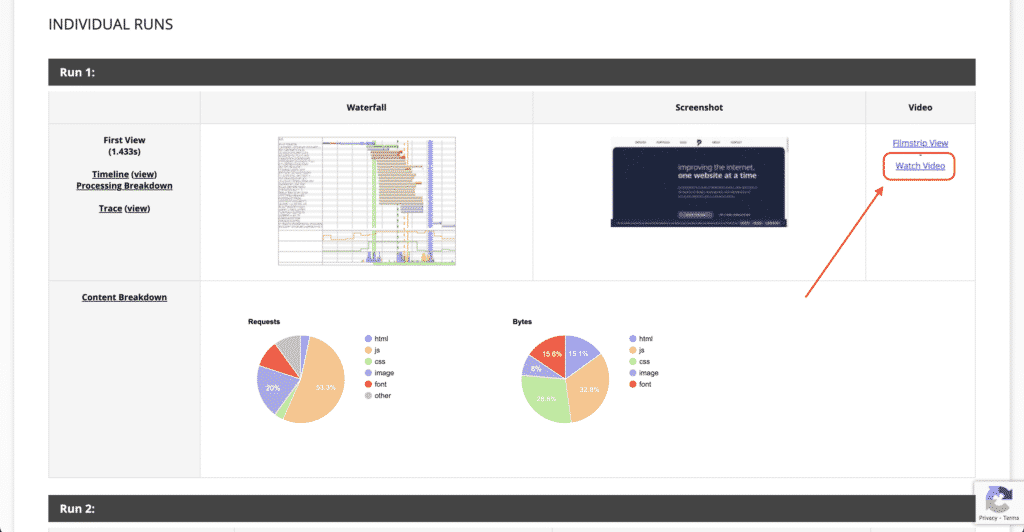
It also provides a detailed waterfall view you can examine to see when different content loads, when the first item loads, when the last one loads, and so on.
You can also watch a live video to see how your website page loads. Check out the videos from here.
This tool is great for people with more experience and knowledge, who already know what they’re doing. The tool does not suggest what can be done to improve the speed of the website and the performance analysis it generates is more technical.
Method 6: Use Query Monitor to identify slow plugins
One of the best things about WordPress is the ability to utilise different plugins. They let you optimise and customise the site as you choose. However, with all the free options available it’s easy to overdo it and fill your website with plugins you don’t really need.
Page speed is often affected by these plugins, so make sure you often check which plugins you use and remove the ones you no longer require.
Although the number of plugins used on your website plays a huge role in your website performance, sometimes that’s not the case.
It’s possible that you are using 1-2 bigger plugins that are forcing your website server to work overtime.
There is a plugin called Query Monitor, which can help you identify the performance of your WordPress plugins. There are a lot of positive reviews from people who use it on their websites.

Query Monitor can be accessed through the admin bar in your WordPress website.
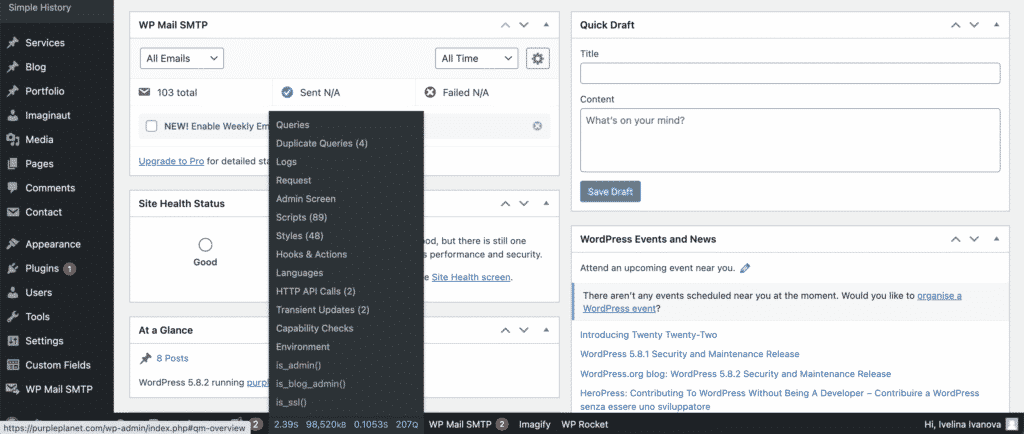
Using the Queries tab in Query Monitor can show you plugin query times, and how long it takes the server to process each. You can also use the “Queries by components” to see an overview of the total time spent on queries for each plugin.
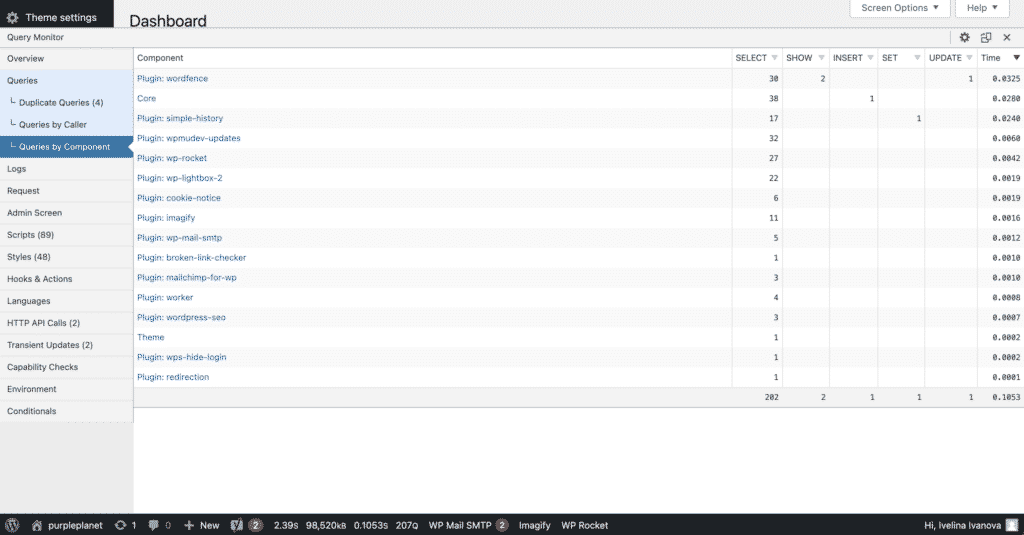
You can identify which plugins are slowing down your website and consider whether you can find an alternative that works better or whether you can even remove them from your website altogether. If you use a plugin once every 2-3 months, it is better to install and uninstall it than to keep it on your website and wait for it to load every time your website loads.
Did you check your website with these tools?
If your website is in great shape, well done!
If you’ve identified that your website is slow it’s time to do something about it.
Write down all recommendations and issues you received from the different tools you’ve used to check your website. See which recommendations are frequently mentioned.